Kick-Starting Hybrid Multi-Cloud Management with NetApp Cloud Insights


Ezra Tingler
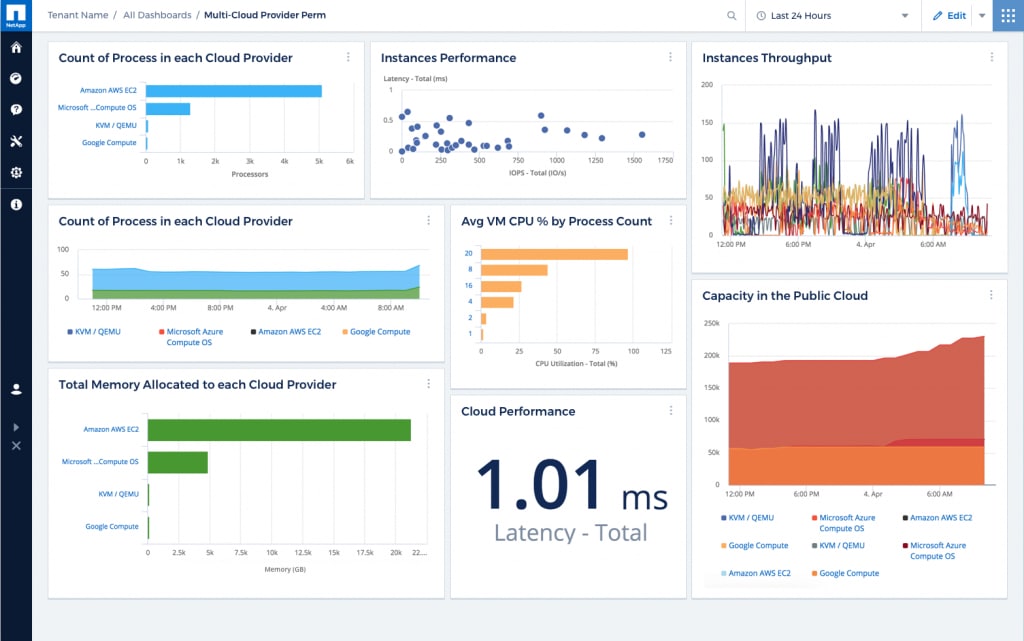 Cloud Insights Dashboard[/caption]
Storage capacity, efficiency, and performance are key responsibilities that my colleagues and I manage as part of the enterprise IT storage team at NetApp. We currently maintain approximately 75 PB of storage and 450 storage controllers supporting hundreds of corporate business applications. To best manage our environment, we have relied on several NetApp solutions in the Data Infrastructure Management suite in the past, like OnCommand® Insight (OCI) and OnCommand® Unified Manager (OCUM).
Over the past few months I have also used NetApp Cloud Insights, a SaaS subscription-based service, to monitor, troubleshoot, and optimize 95% of our storage and virtual infrastructure. This includes ONTAP, SolidFire, StorageGrid, E-series, HCI, and others running across our hybrid multi-cloud and multiple data centers. And frankly, I am very impressed. You can give it a test drive using the 14-day free trial (find the specifics at cloud.netapp.com).
I started by requesting access at NetApp Cloud Central. Once my NetApp Cloud Insights instance was created, the configuration was straightforward. I logged in to review the documentation available under the help menu and found an intuitive implementation guide. I was on my way.
I installed acquisition units in our two primary data centers. These acquisition units run on a virtual machine (with access through the firewall) to act as a central consolidator and pull data and configuration details like vendor, capacity, memory utilization, and more. Acquisition unit installation was a simple copy and paste. I added data collectors for each managed unit and soon it began collecting data. The data collectors use APIs to access the environment and gather the required information. NetApp Cloud Insights then uses that data to perform the analysis necessary to monitor, troubleshoot, and optimize the complete environment. Data collectors are also easy to add by clicking the add data collector button, choosing a data collector, and completing the form. Expansion is a breeze—just add another data collector.
Cloud Insights allows me to create custom dashboards and run specific queries on our environment quickly and easily. Dashboard creation and queries are also well documented using the documentation found under the help menu. In a matter of a few minutes I was able to create a custom dashboard to get a general status of our entire environment. I also created a “Countdown to Extinction” dashboard within Cloud Insights to identify end-of-life (EOL) storage and the applications they support. This allows us to proactively decommission storage which will soon become EOL—before it becomes an issue. Compared to OCI, which is maintained in our virtual environment, NetApp Cloud Insights runs in the cloud and updates are performed on a regular basis to your instance. This eliminates the need for server reboots and downtime.
Next Steps
To augment our ticketing and application resource management capabilities, in the future I would like to integrate Cloud Insights with our Configuration Management Database (CMDB) within ServiceNow. Regardless if our storage infrastructure is on premises or in the cloud, we want to track it in our CMDB to map business capabilities down to the lowest level.
I am also eager to make use of the IO Density dashboard to easily identify and add custom annotations to volumes which have little-to-no usage. How often has this scenario happened to you: An end user requests a storage volume and then doesn’t use it? Worse yet, the server using the volume is decommissioned and the data is abandoned. Armed with this information, I can label the volume and contact the end user to determine if the volume is still required. My management appreciates anything we can do to keep infrastructure costs down and fully utilize IT assets.
The same dashboard can be used to monitor specified services levels in our environment. The custom dashboards can be used to improve mean-time-to-resolution (MTTR) by determining if storage is the culprit during an outage. If storage is not the issue, then our Incident Managers can quickly redirect their troubleshooting to other layers of the stack.
My experience using Cloud Insights has been very positive and I encourage my peers in the industry to check it out at cloud.netapp.com. It will be time well spent!
The NetApp-on-NetApp blogs feature advice from subject matter experts from NetApp IT who share their real experiences using NetApp’s industry-leading data management solutions to support business goals. Visit www.NetAppIT.com to learn more.
Ezra Tingler
Ezra Tingler is a Senior Storage Engineer in NetApp’s corporate IT team. In this role, he is a member of Customer-1, which acts as the first adopter of NetApp’s products and services. Since 2011, he has been the lead for both the storage ecosystem services and storage capacity and performance service lines. Ezra is responsible for the automation and management of IT storage capacity, efficiency, and performance. This includes overseeing its architecture, procurement, deployment, standards development, and maintenance. He has more than 22 years of IT experience.